New study finds simple visuals can cut through climate change apathy
Researchers have discovered that presenting climate data in stark, binary formats makes people more likely to perceive and react to the effects of global warming.
In short:
- A study concludes that people responded more strongly to black-and-white data, such as whether a lake froze each winter, than to gradual temperature graphs.
- The effect held true across multiple experiments and real-world data, revealing a cognitive bias where people notice sudden changes more than gradual trends.
- Scientists suggest using clear, simplified visuals to convey climate change’s impacts, though such methods may sacrifice some data complexity.
Key quote:
“Psychology effects are sometimes fickle. This is one of the cleanest effects we’ve ever seen.”
— Rachit Dubey, professor of communications at the University of California, Los Angeles
Why this matters:
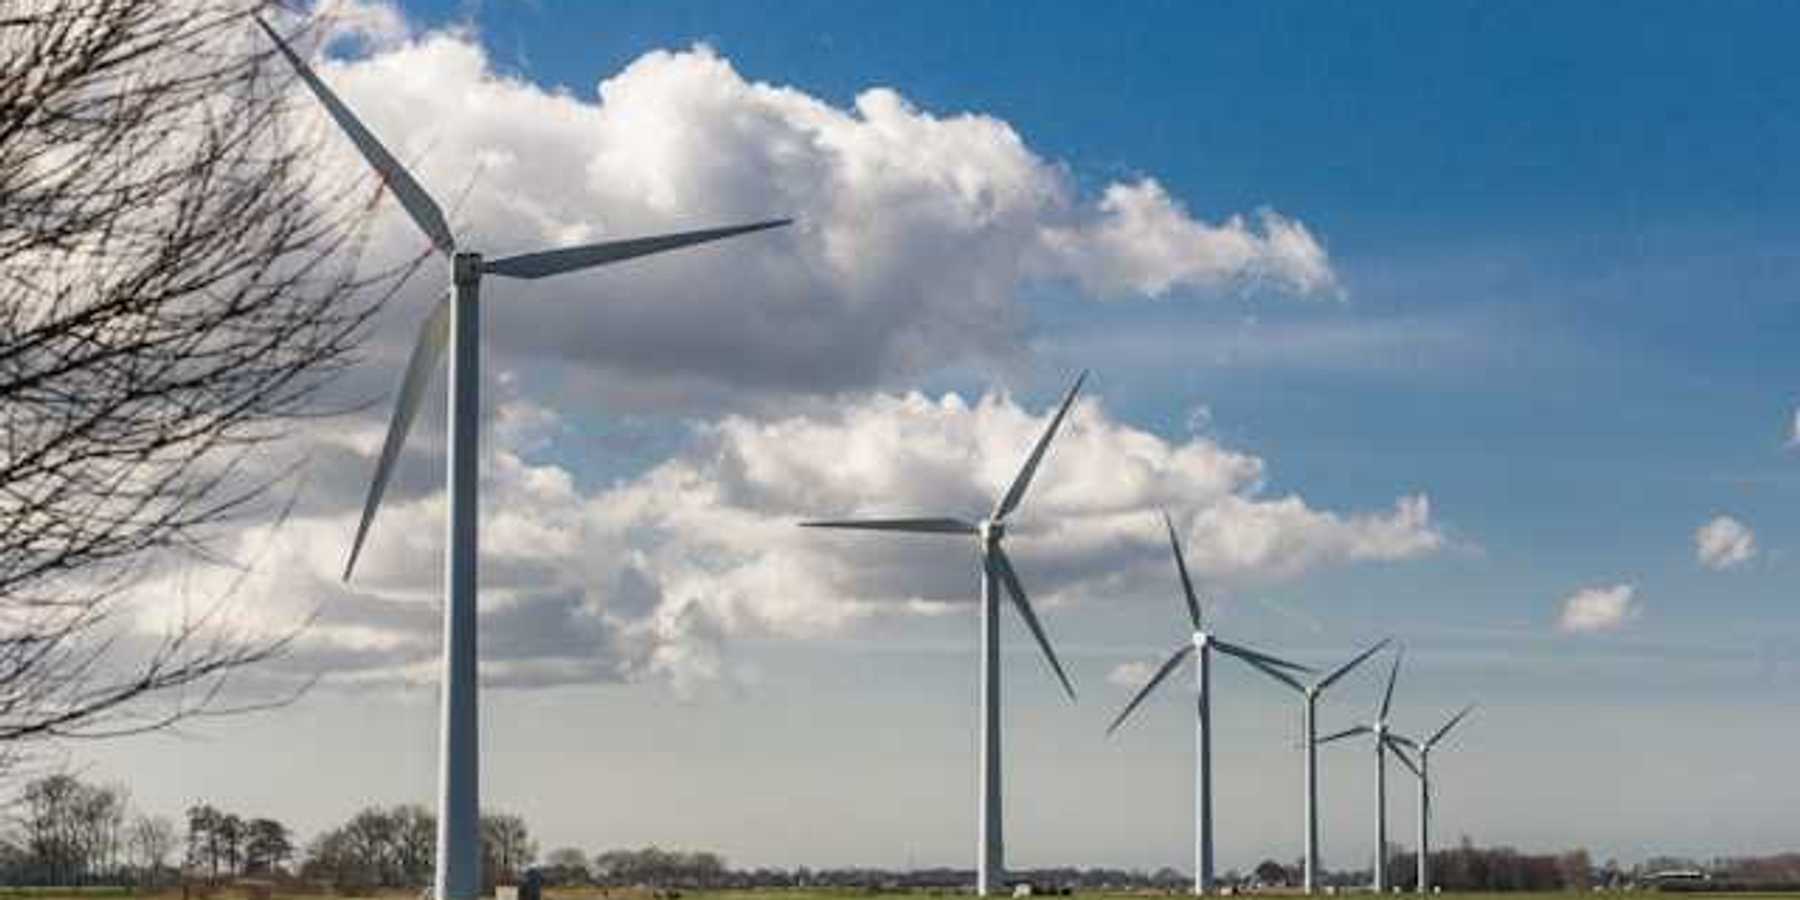
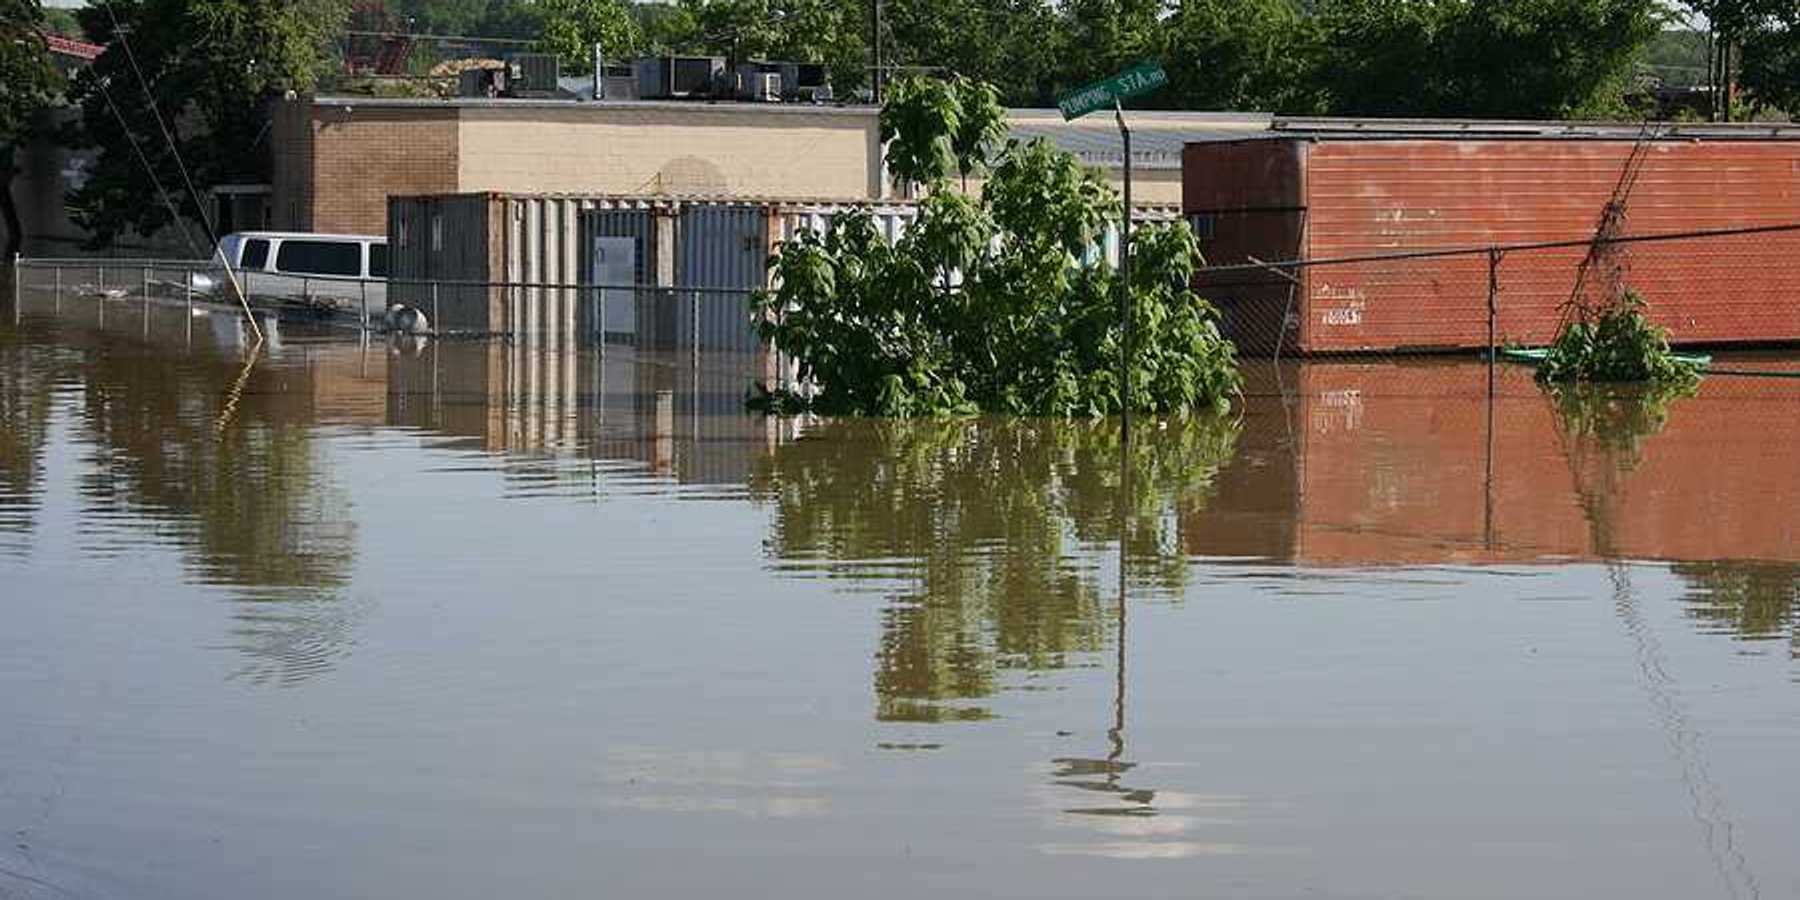
Communicating climate change effectively remains a critical challenge. Despite worsening storms, fires, and floods, public concern often lags, partly because people normalize gradual environmental changes — a phenomenon known as “shifting baselines.” This latest study provides evidence that simple, binary data visualizations can jolt people’s perceptions. The success of tools like the “climate stripes,” which compress decades of warming into bold color changes, further supports this approach. As climate impacts accelerate, finding ways to sustain public attention could influence policy, preparedness, and everyday choices.