

Kendra Pierre-Louis
25 September 2017
ImpactsA warming Arctic can actually make our winters colder.
The winter of 2014-2015 is remembered, at least by many, as the winter that the city of Boston lost its mind. That is the winter when New England—a region synonymous with frost—managed to capture national attention for receiving what can only be described as preposterous levels of snow. The city trounced its previous record of 107.6 inches, set in 1995-96, by a whole inch. In an average year, the city is hit with around 43 inches.
But 2015 wasn't just unusually snowy. It was also unusually cold. Beantown achieved the frigid distinction of hitting the longest stretch of temperatures below 40 degrees since record keeping began in 1872. And it wasn't just Boston that got chilly. Those living in the mid-northerly latitudes have noticed that unusually warm winters, like the one that happened the following year (2015-2016), have been interspersed with unusually cold ones. A 2016 study in the Journal of Geophysical Research found that extreme winters are becoming more common in the United States. A recently released study in the Bulletin of the American Meteorological Society could help explain why.
The culprit, somewhat ironically, is a warming Arctic. As the Arctic warms due to climate change, it’s causing shifts in what’s called the polar vortex—a large area of low pressure and cold air surrounding both of the Earth’s poles.
The new study isn’t the first to find this link; earlier reports have shown that a warming Arctic can paradoxically lead to colder winters. What this study does, however, is shed some light onto how.
The researchers found that ordinarily, the counter-clockwise flow of air that defines the polar vortex helps keep colder air near the Poles. But when sea-ice north of Scandinavia and Russia melts, the now ice-free ocean releases more warmth, which can rise as far as 18 miles into the stratosphere. It weakens that counter-clockwise circulation, allowing more cold air to escape further south. That leads to those unusually colder winters. The study authors found that they could attribute many of the coldest winters over the past 40 years to the weakening of the polar vortex.
The researchers came to this conclusion by analyzing January and February atmospheric wind speed data at regions upward of 60N (or just north of Oslo) between the years of 1979 and 2015. This is generally where the polar vortex is (normally) located. They combed the data to see which winters had a strong polar vortex versus a weak one. They then compared that to average surface temperature to see if there was a correlation—and found that there was one.
When the polar vortex is weaker, lower latitudes (like the United States, and Canada) tend to experience colder winter temperatures. The researchers then tried to figure out why the polar vortex varied in strength, which is when they found the relationship between sea ice loss and circulation shifts.
It’s not just the United States experiencing this periodic plunge in winter temperatures. In fact, the effect is stronger over Asia and Europe. In 2012, many Russians froze to death as the nation registered the coldest winter in over 70 years. Temperatures plunged to -58 F. Last winter Stockholm, Sweden was buried in 15 inches of snow as a cold front hovered in the region. It’s the most snow to fall in the month of November in 111 years of record keeping.
"Our latest findings not only confirm the link between a weak polar vortex and severe winter weather, but also calculated how much of the observed cooling in regions like Russia and Scandinavia is linked to the weakening vortex. It turns out to be most," study co-author Judah Cohen from Atmospheric and Environmental Research/Massachusetts Institute of Technology said in a statement. "Several types of weather extremes are on the rise with climate change, and our study adds evidence that this can also include cold spells, which is an unpleasant surprise for these regions."
In other words, though many think of climate change as "global warming," the reality is more complicated. A warming climate sends ripples of change across the entire climate system, which sometimes means some very cold winters. The biggest issue isn’t the cold; it’s the variability. Because of climate change, we now vacillate between winters so warm that ski resorts are forced to close early, to winters so cold and snowy that ski bums can’t even reach the slopes.
Keep reading...Show less
Read the Full Article on www.popsci.com
08 September 2017
Predicting a hurricane's intensity is only going to get harder.
This week Hurricane Irma—a grandmotherly name for a monster of a hurricane—made landfall directly over the Caribbean islands of Antigua, Barbuda, and Saint-Martin. The impact was so severe that Gaston Browne, Prime Minister of Antigua and Barbuda, went on Facebook Live to say that 90 percent of Barbuda was destroyed. Irma is the first Category 5 storm (a storm with sustained winds of at least 157 miles per hour) to ever form in the Atlantic. Hurricane Harvey was a mere Category 4—its powers of destruction came from its water content, not its wind speeds.
Irma is expected to reach Southern Florida by Sunday, leading many to worry that the United States will face two catastrophic storms in under a month. But before Irma arrives on the mainland, she will likely heap devastation on Puerto Rico and the Virgin Islands, as well as on Cuba, Haiti and the Dominican Republic. How do we know this? Because of storm tracking technology that allows us to make lifesaving predictions. Even though more people live in the path of hurricanes and tropical storms than ever—by some estimates, the global population exposed to tropical cyclones has increased by 300 percent—fewer people die from these storms. Improved predictive capabilities, like those made possible by NOAA Satellites that may be on the budgetary chopping block, allow us to see when a storm is coming and, when necessary, get out of harm’s way.
But Kerry Emanuel, a meteorologist and climate scientist at the Massachusetts Institute of Technology (MIT), warned in an article released earlier this year in the American Meteorological Society that climate change might make hurricanes harder to predict. And that will make them deadlier.
The issue, according to Emanuel, is that while our ability to see storms and understand where they’re going has improved significantly, we’re still not great at forecasting intensity—how strong a storm will be. Storm intensity matters, because a weak storm might just mean staying home for the day, while a strong storm may require evacuation.
Rapidly intensifying storms—systems that gain most of their power right before they make landfall—are the hardest to predict. If a storm intensifies quickly, that shortens the period that people and local authorities have to decide whether or not they should evacuate. And if an evacuation is determined to be the best course of action, rapid intensification also reduces how much time people actually have to get out. Right now, for example, predictions related to Irma have given Floridians almost a week to stock up on supplies and create evacuation plans. Some residents have already evacuated. That puts the region in a much better position than if the storm had only grown to troubling intensity with a day or two to spare before landfall.
Emanuel points to Hurricane Audrey, which hit Louisiana in 1957 and caused more than 400 deaths (the sixth deadliest storm on record), and 2007's Hurricane Humberto as two examples of this rapid intensification. The 1957 storm—which was pre-satellite, and thus tracked by radar—was predicted to make landfall late in the day on June 27. The evening before, local news media encouraged residents to wait until morning to venture out for supplies. But the storm rapidly intensified from 98 mph (Category 2) to 150 mph (Category 4) and also sped up, leaving many wholly unprepared for its arrival—both earlier and much stronger than predicted.
Humberto was a weaker storm, and as such it was less deadly. But it followed the same pattern. The storm intensified by 37 percent in just under 12 hours, which suggests that even the increased predictive capabilities brought to us by satellite technology aren't yet up to the task of predicting such rapid storm intensification.
Currently, the Atlantic hurricane season stretches from June to November, because that's when weather conditions are most suitable for the formation of storms. Here in the United States, the oceanic temperatures are at their warmest during this period—and it's warm water that fuels a hurricane. As the global climate warms, the ocean heats up as well, providing fuel to power larger, more intense hurricanes. Hurricane Harvey and Irma both formed in seas that were warmer than usual, likely due to climate change.
To understand how climate change would affect this rapid intensification issue, Emanuel used six different computer models to simulate both the wind and temperature effects of a changing climate over the next century. He used that information to figure out the rate of intensification, or how much more intense hurricanes will get. Climate change doesn't cause hurricanes—they happen whenever the conditions are right. But because warm water feeds the growing storms, hurricanes are likely to be more intense as the planet heats up. Emanuel found that a pre-climate change tropical cyclone with wind a speed of 30 miles per hour in the 24 hours before landfall—a storm that doesn’t quite rank as a hurricane—would end up with winds as intense as 126 miles per hour in the 24 hours before landfall given post-climate change conditions.
Rapidly intensifying storms already exist, but under our old climate—pre-climate change—most of them looked more like Humberto than Audrey. A weak tropical storm becomes a slightly-less-weak tropical storm, not a roaring hurricane.
In applying his models to historical weather data, Emanuel found that a hurricane which intensifies by roughly 70 miles per hour within 24 hours of making landfall—enough to shift it from a Category 1, where most people would be fine staying home, to a Category 4, which causes catastrophic damage—should occur once a century. By 2100, such a hurricane could occur every 5 to 10 years thanks to warmer waters. Intensifications of 115 miles per hour within the 24 hours before a storm makes landfall, which essentially don’t exist under current conditions, may happen at least once a century if we do nothing to stop climate change.
“I am at a complete and utter loss for words looking at Irma's appearance on satellite imagery,” tweeted Taylor Trogdon, a Senior Scientist at the Storm Surge Unit of the National Hurricane Center, on Tuesday night. Decades of research has gone into making it possible for Trogdon to see and interpret the satellite imagery that left him speechless. But even with our improved forecasts, climate change could increasingly leave us blind to these dangers until it's too late.
Keep reading...Show less
Read the Full Article on
www.popsci.com
12 July 2017
Greenland's ice sheet is full of toxins waiting to break free—and microbes that eat them.
As the Greenland ice sheet melts due to climate change, a new study in journal Environmental Letters suggests, pollution trapped inside could ooze back into the environment. But microbes that have evolved to chow down on such toxins could help us out.
Despite the Arctic’s pristine image, pollution still makes its way to our most northerly latitudes. Earlier this year, researchers reported that even our plastic waste is clogging up the Arctic seas.
Similarly, persistent organic pollutants including mercury, which are released from coal fired power plants, and polychlorinated biphenyls (better known as PCBs) also end up in the Arctic, where they lurk inside the snow and ice on glaciers. PCBs were once widely used as a flame retardant, but were phased out in the 1980s as research found that they were harmful to human health and take a long time to break down. As the ice sheets melt, they release this trapped pollution back into the larger environment, raising questions about how local ecosystems will handle the influx.
In the summer of 2013, researchers from the Technical University of Denmark, the University of Copenhagen, and Charles University in the Czech Republic headed to the Greenland ice sheet—660,000 square miles of ice that cover 80 percent of the island nation—to figure out just how bad this toxic melt could be. The Arctic is melting faster than the rest of the planet, providing insight into what changes the rest of the planet can anticipate as the climate warms. As the ice sheet (which rests on land) melts, it raises global sea levels, triggering broader shifts in the weather system.
greenland
Meltwater in crevasses in southern Greenland.
NASA/John Sonntag
Once in Greenland, the researchers took samples of cryoconite, a powdery windblown dust made up of microbes, soot, and small bits of rock that builds up on snow glaciers or ice caps, at five different locations on the ice sheet. They ran genetic analysis on the microbes found in the cryoconite, looking for signs that the microbes could resist or even degrade known Arctic contaminants. At least some of the microbes they found had the ability to break down some of the contaminants. When they compared the DNA of microbes in more contaminated areas versus those in less contaminated areas, they found that both sets contained the genetic profiles they'd need to fight off pollutants.
"The microbial potential to degrade anthropogenic contaminants, including polychlorinated biphenyls (PCB), polycyclic aromatic hydrocarbons (PAHs), and the heavy metals mercury and lead, was found to be widespread, and not limited to regions close to human activities," says Aviaja Lyberth Hauptmann, a Greenlandic scientist based at The Technical University in Denmark and lead author on the study.
“It’s potentially good news that degraders are found in the melting ice ecosystem,” says Ross Virginia, Director of the Institute of Arctic Studies at Dartmouth University, who was not involved in the study.
This isn’t, however, a carte blanche to pollute as much as we want with the expectation that Arctic microbes will clean up the mess. Because microbes generally develop resistance to a pollutant because of close proximity to that pollutant, the fact that microbes far from contaminated habitats had the same genetic resistance as those flourishing in the midst of toxins suggests that from a microbiological perspective, that the contaminants are everywhere. Greenland is really not pristine.
At the same time, it isn’t clear just how much pollution is trapped in ice sheets, how much (or how quickly) that pollution will be released over time, or how much pollution the microbes will actually be able to break down. All of those questions remain to (hopefully) be answered by future research.
In other words, it's good news that some microbes are adapting to survive—and fight—our pollutants. But that doesn't mean we should continue to create a world where they need to do so.
Tags:
greenland ice sheet Greenland climate change microbes pollutants Environment
Keep reading...Show less
Read the Full Article on
www.popsci.com
19 May 2017
Exclusive: House Science Committee members just sent a letter to President Trump insisting he stop relying on fake news.
Members of the House of Representative Committee on Science, Space & Technology—including representative Don Beyer (VA), Jacky Rosen (NV), Mark Takano (CA), and a number of other Democrats—have signed and submitted a letter to President Trump expressing concern over the President's methods of receiving scientific information. The letter states that by failing to appoint a qualified director to the White House Office of Science and Technology Policy or adequately staff the department, the President has left himself vulnerable to “misinformation and fake news,” noting that Trump has, “a tool at your disposal in this regard, should you wish to make use of it, in the Office of Science and Technology Policy (OSTP) which, under your administration, has been left largely unstaffed and without a director.”
Congress created the White House Office of Science and Technology Policy under the National Science and Technology Policy, Organization, and Priorities Act in 1976 with the goal of providing the President and those within the Executive Office quality advice on the creation and modification of policies that directly affect science and technology. The role was first created informally under President Kennedy, whose staff recognized a need for scientific expertise to guide his decision making on issues like the NASA moon mission and evolving medical and military technologies.
“The Trump Administration has been defined by chaos and alternate facts, but it has also consistently shown total disregard for science," Beyer told Popular Science. "Trump himself famously called climate change a Chinese hoax, so it's not surprising that he has been repeatedly taken in by false stories that may reinforce his worldview but bear no resemblance to the truth. We are urging him to appoint reliable staff informed by sound science, including a Director of the Office of Science and Technology Policy, so that he can at least give himself better access to accurate information which we hope will lead to better policies.”
The letter is not the first time that the administration has received criticism over its apparent disregard for science and the scientific process. The President’s rumored choice for the role of lead scientist at the United States Department of Agriculture is Sam Clovis, a talk show host with a doctorate degree in public administration—not in a scientific field. Previous undersecretaries have been experts in nutrition or public health, or held degrees in biochemistry or plant physiology.
In addition, earlier this month the EPA dismissed several members of its science advisory board while the Department of the Interior placed its own “under review”. Although members typically serve for two to three years, many of these members were dismissed after having served only one. Statements made by members of the administration suggest that they will be replaced by scientists that are more closely tied to industry, which has many concerned that the board will act in the best interest of corporations and not of the American people.
“There have always been a few industry folks on the science advisory board,” says Morgan Granger. Granger is the Hamerschlag University Professor of Engineering at Carnegie Mellon University and a former chair of the EPA Science Advisory Board. “The selection criteria have always been to find the people with the very best science. And you need a diversity of science expertise because the agency works across a whole wide range of things, but informally staff has always tried to make sure they balance in other respects as well, with folks in industry.”
Members of the science advisory board include academic scientists as well as researchers for corporations, including Proctor and Gamble and Exxon Mobil. You can get a taste of what these panels are like by reading a transcript.
“No scientific advisory body I know has ever been anti-industry, and I've studied quite a number of these bodies over the years,” echoes Sheila Jasanoff a Professor of Science and Technology Studies at Harvard University who literally wrote the book on science advisory panels. “Even in the National Academy of Sciences and the National Research Council, there's always a balance, and the federal advisory committee act says that there should be a fair balance in terms of the interests represented.”
Science advisory boards were created in recognition of the fact that scientific outcomes aren't black and white. Scientists can reach a consensus on issues they've thoroughly investigated, but the policies that should follow aren't always cut and dry. A drug with a laundry list of side effects, for example, may be intolerable for treating a cold but perfectly acceptable for treating life threatening diseases. The EPA’s Science Advisory Board, for example, was created by Congress in 1978, after a generation of American wildlife was systematically poisoned by herbicides and pesticides that were supposed to make life better for Americans. Those organochloride pesticides still persist in the environment.
“The [EPA] Science advisory board does basically two things,” says Granger. “First, it reviews major agency products—if the agency does a piece of analysis for a new regulation or something like that, then the science advisory board is typically asked to look at it and provide commentary on whether they've got the science right, whether the analysis was done correctly. It doesn't make policy prescriptions.”
Science advisory boards tackle the question of, “how do you bridge uncertainty in a complex society where you can't know everything?” says Jasanoff. “For that you need balance.”
“What we're seeing right now are things that are pathological and problematic," she adds. "One is targeting specific individuals, which is always a bit suspect in the science world. And two, a replacement of one type of stakeholder with another, instead of recognizing that it's the multiplicity of the stakeholders that produces the reliability of the knowledge.”
Without this kind of balanced, outside perspective, misinformation thrives.
The House letter states that “Disseminating stories from dubious sources has been a recurring issue with your administration,” pointing to a May 15, 2017 Politico article which notes that Trump’s “Deputy National Security Advisor passed along printouts of two Time magazine cover stories—one, a previously identified and debunked internet hoax purporting to be from the 1970s warning of a coming ice age, and the other, from 2008, a special report on global warming, with the intention of undermining concern about climate change.”
Of course, the representatives responsible for the letter don’t speak for all members of the committee. In fact, the committee’s official Twitter account often disseminates the sort of anti-science news Beyer and co. are trying to get off of the President’s desk.
Here's the full text obtained by PopSci:
Dear President Trump:
We are concerned about the process by which you receive information. According to a story reported by Politico on May 15, 2017, your Deputy National Security Advisor passed along printouts of two Time magazine cover stories – one, a previously identified and debunked internet hoax purporting to be from the 1970s warning of a coming ice age, and the other, from 2008, a special report on global warming, with the intention of undermining concern about climate change.
Disseminating stories from dubious sources has been a recurring issue with your administration. You previously made the false claim that President Obama ordered your phones to be “tapped” based on false reports which have subsequently been contradicted by senior U.S. intelligence officials. You also falsely stated that millions of votes were cast against you “illegally” after reading about subsequently-debunked “research” pushed by alt-right websites. This, by no means, is a comprehensive list of your activities peddling fake news.
Where scientific policy is concerned, the White House should make use of the latest, most broadly-supported science. You have a tool at your disposal in this regard, should you wish to make use of it, in the Office of Science and Technology Policy (OSTP) which, under your administration, has been left largely unstaffed and without a director. If you appoint a qualified OSTP Director, you will have a reliable source of policy advice for matters related to science and technology, which forms the bedrock of our national security and economic power.
Until the OSTP is adequately staffed and the director position filled by a qualified, objective scientist who understands the difference between alternative news peddled on alt-right websites and legitimate well-vetted scientific facts, we fear that you will continue to be vulnerable to misinformation and fake news. Relying on factual technical and scientific data has helped make America the greatest nation in the world. We therefore urge you to quickly appoint a qualified, widely-respected candidate to direct OSTP. Furthermore, it’s critical that anyone you nominate represent the views of the broader scientific community, as was the case for both Presidents Bush and Obama.
Keep reading...Show less
Read the Full Article on
www.popsci.com
06 April 2017
Climate change could make severe turbulence even worse.
Airplane passengers are in for an increasingly bumpy ride according to a study released today in the journal Advances in Atmospheric Sciences. Climate change is altering the jet stream, making severe turbulence more likely. The study builds on earlier work which found that climate change would lead to bumpier airplane rides. What makes the new research unique is that it quantifies how much different kinds of turbulence will increase—59 percent in the case of light turbulence, a 94 percent increase in moderate turbulence, and 149 percent increase in severe turbulence.
For the one in four Americans who are afraid of flying, any jostling could be considered severe. But like an earthquake, turbulence is rated on a scale. One is light—gentle enough so passengers may not notice it—three is moderate, or enough to jostle a drink, five is severe, and seven is extreme.
“Anything above five is by definition stronger than gravity,” says study autho Paul Williams, an atmospheric scientist at the University of Reading in the United Kingdom. “What that means is that anything that’s not strapped in will potentially be projected around inside the plane. That would include passengers.”
airplane turbulance
Shake, Rattle, But No Rolls
Turbulence happens when an air mass moving at one speed meets another air mass moving at a different speed. The meeting causes a sudden shift in airflow, leading air to move chaotically. It’s a bit like trying to walk down the street on a particularly windy day, and being buffeted about in multiple directions. So, a plane moving into turbulent air may have its left wing hit by an upward gust causing the plane to bank right. Similarly, if both wings are suddenly hit by a downward gust, the whole plane might drop a bit, which isn’t great for anyone inside.
Last October, an Air New Zealand flight from Ho Chi Minh to Auckland encountered turbulence so severe it was forced to turn around after two crew members suffered critical injuries. That same year, a JetBlue flight from Boston to Sacramento was forced to make an unplanned landing after it hit a patch of turbulence that sent 22 passengers and 2 crew members to the hospital. In 2015, an Air Canada flight from Toronto to Shanghai experienced turbulence that led to the injuries of 21 people. The plane made an emergency landing in Calgary, Alberta. And in 2014, a United Airlines flight from Denver to Billings, Montana hit turbulence so severe that five people went into the hospital.
Satellite observations dating back to the 1970s show that because of climate change, different parts of the atmosphere are warming up at different rates. At 30-40,000 feet, the low latitude tropical regions are warming much faster than the high latitude arctic regions (which is the opposite of what’s happening on the ground). This temperature difference has always driven the jet stream, but as tropical regions warm up faster than the arctic, that difference grows—and the jet stream becomes both stronger, and less stable. Turbulence is coming along for the ride.
“Turbulence can actually damage planes,” said Williams. “There was a plane flying over the Colorado Rocky’s on the 9th of December 1992 through some extreme clear air turbulence—it would have been a seven [on the scale]. Six meters of the left wing broke off and one of the engines got torn off as well.”
Plane engines, Williams told PopSci, are affixed with aptly named, ‘shear nuts and bolts.’ The engines are designed to shear off planes if they become unstable. “The fact that the engine broke off probably saved the life of the people on the plane, because the last thing you want is an unstable engine kind of hanging off a plane causing instabilities.”
This kind of damage is rare—in most cases turbulence is still more about comfort than safety, and there hasn’t been a single plane crash due to turbulence since the 1960s. But even light and moderate turbulence will cause wear and tear on a plane. That means the need for inspections—for planes to be taken out of service and maintained—will also go up. It’s a significant economic burden for an industry already operating on razor thin margins.
While the seasoned traveler may wonder why pilots don’t just fly around the turbulence, the answer is simple: the pilots can’t see it. Though we tend to think of turbulence as being associated with storms, the kind of turbulence Williams focuses on is related not to weather but to the jet stream, or the bands of strong wind in the upper levels of the atmosphere.
“We call it clear air turbulence to distinguish it from the other kinds of turbulence which is in clouds,” said Williams. “The pilot can see the clouds, so he or she knows that the turbulence will be there and will avoid trying to fly through. But clear air turbulence is particularly hazardous precisely because it’s invisible. It tends to strike when the seatbelt light is switched off and passengers are moving around inside the cabin.” On average, patches of clear air turbulence tend to be more than half a mile tall (3,280 feet) and 37 miles wide.
Pexels
Clear air turbulence is particularly dangerous since pilot's can't see it coming.
Predicting Turbulence
Williams was able to predict increases in turbulence by running a climate model. He ran it first under control conditions, using preindustrial levels of carbon dioxide for the equivalent of twenty years. He then ran a second simulation where the CO2 is double that of the pre-industrial levels—roughly where we’ll be by the middle of the century if we don’t change our behaviors.
But climate models don’t actually have this kind of turbulence built into them. “Williams took 21 vetted, commonly used indicators for turbulence and looked for those in the climate model,” said Kristopher Karnauskas, a researcher in the Department of Atmospheric and Oceanic Sciences at the University of Colorado Boulder who was not involved in the study. “It’s not just limited to one predictor of turbulence, because no one predictor of turbulence is perfect or always right, so he used a broad ensemble approach.”
Williams then compared the control run with the elevated CO2 condition and calculated the amount of turbulence in both of them. That’s how he found the increases.
Kendra Pierre-Louis
Climate change will increase turbulence by a lot.
Why Models Matter
Climate models have come under fire recently, in part because to lay people they can seem disconnected from reality. That's why Karnauskas likes to use TV screens to explain how they work.
“With a climate model, you take the planet and you cut it up into grid cells like the pixels on a TV,” Karnauskas. “Each of those grid cells knows all the laws of physics. It looks at its neighbors around it and says ‘is it warm over there, is the wind coming from this direction, and then it marches forward in time.” By being fed those base conditions, the model can make extrapolations about the future.
In fact, the only limitation of the study that Karnauskas notes is that it only uses one climate model, which he says limits our ability to categorize the full certainty of the results. But this isn’t the first study to suggest that the jet stream is changing along with the warming climate.
Both Williams and Karnauskas have published studies that found that because the jet stream is getting stronger, eastbound flights from the U.S. to Europe will get faster, while westbound flights from Europe will be slower. This is backed up by real world incidents.
In January 2015, a flight from New York’s JFK airport to Heathrow took only 5 hours and 16 minutes because the jet stream was so strong. Ordinarily, that flight takes longer than six hours. During that same period, westbound flights from London and Paris to New York battled such strong heads that they burned more fuel than expected, requiring stops in Maine for refueling
It’s important to note that Williams' study only looked at the North Atlantic—its conclusions can’t be extrapolated for other routes. At the same time, however, it’s important to recognize the impacts that climate change will have on the aviation industry so that companies can better plan and prepare for everything from plane maintenance and repair to fueling.
“For decades, all of the focus on climate change and air travel was about how air travel is going to make climate change worse,” said Karnauskas. “But this kind of study, and other studies around climate change making flight times longer, are a new wave of looking at that relationship. It's showing that climate change can feed back on the industry itself. It’s not just that air travel affects climate—we know that’s true. But air travel is being affected by climate change.”
Keep reading...Show less
Read the Full Article on
www.popsci.com
26 January 2017
How a deadly heat wave led to disastrous floods 2,000 miles away.
The day had dawned blue and clear in the village of Stok in the Indian Himalayan region of Ladakh. Cows ambled along the mountain passes, motor scooters zipped across town and village children worked on a trash cleanup project. But around 6:30 p.m. on Aug. 5, 2010, the sky turned ominously black. “It turned a really funky dark color that I myself hadn’t seen before,” said Lisa Yangchen Blake, an American who moved to the region to become a Buddhist nun.
The winds picked up, and rain started falling horizontally and diagonally. Blake hopped onto a roof to take pictures, and when she looked across the valley, it was “almost like the clouds were trying to turn into a tornado.” Amid the lightning and the thunder, her friends begged her to come down. “It was like, no, no. Something weird is happening. I want to make sure I document it.”
Four and a half hours later, just across the Indus River from Stok, Tashi Chotak returned to his guesthouse in Phyang, a village 12 miles outside of Leh, Ladakh’s main city. The trekking company owner had been at a wedding party and returned home later than usual. Rain fell intermittently as he headed to bed.
Tashi1 had been asleep about an hour when he was jarred awake by the sounds of a massive storm, “all rain and thunder and lightning in the wind.” He rushed outside with an umbrella, but it was immediately crushed in the downpour. “It was like a waterfall,” he said. A boulder — Tashi estimates it at about 200 pounds — came crashing down the hillside, smashing into a room where his uncle was sleeping. The initial thought of saving the essentials was abandoned; the only goal became getting to high ground. It took Tashi, and his pregnant wife, Cristina, half an hour to cross a tenth of a mile because they kept sinking thigh-high into the mud.
Storms of a certain type aren’t unusual in the region in August. It’s the traditional time of the sky dragon, of thunder and of lightning. The storms roll across Ladakh, providing a cacophonous spectacle but typically little rain. Ladakh’s Leh district normally sees only about 3.5 inches of rainfall a year. In the past, talk of moisture in the Himalayas has focused on its dwindling glaciers and the worry that there’s too little water, not too much. That’s visible from above: The mountains are an undulating expanse of brown, punctuated by blue-white glacial caps and ribbons of green — trees and other plants springing to life along the shores of glacier-fed rivers and streams. But locals say the summer rains have become more powerful since 2004. That’s a problem in a region that’s ill-equipped to deal with massive rains, both on a local infrastructure level and when it comes to national forecasts that could help people prepare and protect themselves.
And in 2010, the rains turned the storm season into a thing to be feared. Aug. 5, when Tashi and Cristina fled for their lives, brought the third straight night of intense rain in the region.
Scientists would link Ladakh’s catastrophic flood to a historic heat wave that killed tens of thousands of people in Russia, 2,200 miles away. For weeks, Russia had been experiencing a heat wave that brought the highest temperatures the nation had seen since record keeping began in 1879. Moscow, where high temperatures in during its warmest months of July and August are typically around 73 degrees Fahrenheit, hit 100 degrees; the Siberian city of Omsk hit at least 96.6 degrees — its average high in August is 72. With the heat wave came drought and nearly 600 wildfires across 480,000 acres. The country, known for its blistering winter cold, was boiling that summer. Russia hadn’t seen anything like it in at least 1,000 years, the head of the Russian Meteorological Center said at the time. When it was over, an estimated 55,000 people were dead, killed either by heat stroke or from conditions such as heart and asthma attacks made more likely by the heat.
Kristen Rasmussen, an assistant professor of atmospheric sciences at Colorado State University, helped make the connection between Russia’s heat wave and Ladakh’s rains. By collecting data from a NASA satellite called the Tropical Rainfall Measuring Mission, “we were able to see what kinds of storms and what kinds of systems we typically expect in the climatology,” she said. The satellite also lets scientists see when weather patterns are atypical, so they can better examine them. And the 2010 Ladakhi rains were atypical.
What Rasmussen found is that Russia’s heat wave was caused by big synoptic waves in the atmosphere — we usually see them as curved lines of red and blue on weather maps that show air pressure, temperature and wind direction — that atmospheric scientists call blocking, because they stay fixed in place for days or even weeks. That blocking had a ripple effect on other weather systems. To understand, it helps to think of our atmosphere as a highway system and weather as the cars that traverse its roadways. A blocking pattern acts like a traffic jam encouraging drivers — in this case, the weather systems — to take alternate routes. In summer 2010, that meant dumping intense rain first on Pakistan, which also suffered devastating floods, and then India, where the blocking pattern pushed up the mountain the monsoon rains that usually fell at lower elevations. In other words, it’s not simply that Russia was hot but that the timing of Russia’s heat wave coincided with the monsoon rains that caused the devastation.
The storms that hit Ladakh are called mesoscale convective systems. They’re complex thunderstorms that are larger and wetter than your typical thunderstorm. And the environment isn’t prepared for all that water. Because the area is usually so dry — visitors are encouraged to drink a minimum of three liters of water a day to stave off dehydration — the soil can hold less moisture than in other places. The reason dry soil holds less water is simple: Moist soil is like a net that catches water, whereas in dry soil, that structure breaks down, and the water passes straight through. Many of us have seen this effect in houseplants that we’ve forgotten to water, where more water seems to pass through the pot than stays in it.
“So when the third system came over on the third night,” Rasmussen said, “the soil couldn’t absorb anything. It was already saturated, and that’s when the flash flood really became a problem.”
In pockets all over the region the rain came, not in buckets or sheets but in cataclysmic waves called a cloudburst. Fourteen inches of rain2 fell in two hours. Streams overran their banks, and houses were sheared from their foundations, taking sleeping inhabitants with them.
The next morning in Leh, survivors pulled bodies from the muck and laid them out, Muslim alongside Buddhist alongside Hindu, on the stone floor of the old marketplace, beneath the billowing Buddhist prayers flags and in the shadow of the Jama Masjid mosque. It was the only space big enough to accommodate the dead, which totaled more than 200.
In Phyang, home to Tashi and Cristina, “We had eight deaths, among them one family with two small children,” said Cristina, who before moving to Ladakh spent years doing disaster relief with the Red Cross. Tashi’s uncle, who was in his room when the house was crushed by a boulder, was among the dead. Cristina and Tashi also lost their house. A pregnant Cristina and her husband were forced to hunker down in its skeletal remains that winter, when temperatures in Phyang reach -22 degrees F. “I did not know if the baby will stay or if I will lose the baby. It was a big pressure for everybody,” Cristina said. She gave birth to a healthy boy that February.
The deaths, while tragic, may seem less striking when viewed alongside the thousands of lives lost in Russia. But the Russian heat wave, while unusual, was not wholly unexpected. In 2003, for example, heat waves swept across Europe, killing an estimated 70,000 people. Fifteen of the 17 hottest years on record have come after 2000. As the globe gets hotter, we expect more heat waves. But what happened in India in 2010 was unexpected and is less well understood, raising the question of what other unforeseen catastrophes may lay ahead.
More than six years later, one of the lingering questions is: Why wasn’t anyone warned, especially about the heaviest part of the storm? That’s partly because of a lack of good data. “The cloudburst itself is a phenomenon that’s not well understood,” said Ashrit Raghavendra, a scientist with the Indian National Centre for Medium Range Weather Forecasting. The center is responsible for weather predictions up to 10 days out. Because cloudbursts frequently occur in mountainous locations, where there are few weather-monitoring stations, they’re rarely accurately observed, Raghavendra said. Scientists mostly learn about the storms either through word of mouth or through local media reports, which tend to associate any heavy rains with cloudbursts. The definition varies by region, but a 2010 report by the India Meteorological Department considers it a cloudburst when roughly 4 inches of rain an hour falls in a limited area. In Leh, even as much of the town drowned, the airport’s weather station — the only public station in the region — reported a scant half-inch of rain. Before 2010, the most rain ever recorded in the region in a 24-hour period fell in 1933: 2 inches (though, as noted, record keeping in the region isn’t wholly reliable). But many Ladakhi whose agriculture- or trekking-based livelihoods are intimately tied up with the weather say that the summers are getting wetter.
Raghavendra said that prediction of such phenomena just isn’t possible right now; the technology is limited to carrying out after-the-fact investigations. The meteorologists can know what’s happened but not yet tell residents when these bursts will happen again. And he said India currently depends on Earth-observing satellite data from the U.S. to understand that much.
In 2015, in the face of increasing flood events not just in Ladakh but also in nearby Kashmir, the government announced that it had launched the Himalayan Meteorology Programme. The goal is both to improve short-range forecasting and to better predict severe weather events up to 72 hours in advance. In the meantime, scientists and locals wonder why storms seem to be getting more severe.
The challenge is that this region has not had a history of formal, accurate data collection — the type of data that scientists rely on to assess whether changes are happening and, if they are, why. Geologic and plant data can provide some insight into the past, but meteorological models, Raghavendra said, are generally refined through recorded direct observations, which have been scarce. Mostly what we have to go on are the stories told by the Ladakhi people, who have lived in the region for more than 1,000 years. Studies on the region since the 2010 floods often begin by referencing the paucity of available research. Before 2010, not many people were looking, a story that is increasingly common across the globe as people in far-flung corners experience changes in their weather. It’s why scientists are trying to find ways of connecting indigenous knowledge with our understanding of environmental change. Still, it’s tempting to jump to conclusions and say that the 2010 floods — and milder, but still severe, floods that followed in 2011 — were linked to climate change.
Rasmussen, however, is hesitant to say that, because “we haven’t looked at enough years of data to say whether or not there are changes due to climate changes.” She said that scientists prefer to have at least 30 years of data, and that just isn’t available for the region.
But a separate study in 2012 focusing on the Russian heat waves found that although climate change didn’t make the heat wave significantly bigger or hotter, it made a heat wave of that severity three times more likely. The naturalist John Muir once wrote that “when we try to pick out anything by itself, we find it hitched to everything else in the universe.” Although not definitive, there’s a gossamer thread connecting Ladakh’s devastation to the Russian heat waves, and the Russian heat waves to what humans are doing to the climate.
Still, there’s a feeling of pragmatism that, whatever the cause, the Ladakhi will find a way to adapt — this is a culture that has developed over 2,300 years. The behaviors of the Ladakhi themselves, however, may have made the storm more devastating; in recent years, some have built homes in high-risk locations. “I’ve noticed,” Cristina said, “people are building on land which is really not safe, like on the mouth of the river. If there’s another big flood, they’ll really have a problem.”
Reporting for this story was made possible by a fellowship from the International Center for Journalists.
Keep reading...Show less
Read the Full Article on fivethirtyeight.com
From our Newsroom
Multiple Houston-area oil and gas facilities that have violated pollution laws are seeking permit renewals
One facility has emitted cancer-causing chemicals into waterways at levels up to 520% higher than legal limits.

Pennsylvania health advocates say Trump’s first 100 days in office have caused “100 harms” to local communities
“They're terrorizing these scientists because they want to keep them silent.”
Regulators are underestimating health impacts from air pollution: Study
"The reality is, we are not exposed to one chemical at a time.”

Two years into his term, has Gov. Shapiro kept his promises to regulate Pennsylvania’s fracking industry?
A new report assesses the administration’s progress and makes new recommendations

An open letter from EPA staff to the American public
“We cannot stand by and allow this to happen. We need to hold this administration accountable.”
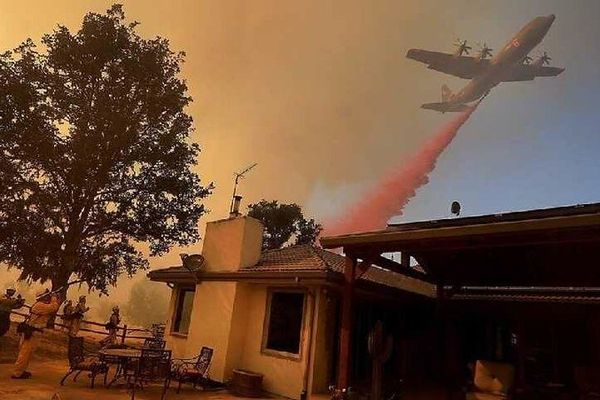
New evidence links heavy metal pollution with wildfire retardants
“The chemical black box” that blankets wildfire-impacted areas is increasingly under scrutiny.